Cloud Computing, 5V ,Data warehousing and Business Intelligence

The 3V volume, variety, velocity,veracity,value Story:

Datawarehouses maintain data loaded from operational databases using Extract Transform Load ETL tools like informatica, datastage, Teradata ETL utilities etc…
Data is extracted from operational store (contains daily operational tactical information) in regular intervals defined by load cycles. Delta or Incremental load or full load is taken to datwarehouse containing Fact and dimension tables which are modeled on STAR (around 3NF )or SNOWFLAKE schema.
During business Analysis we come to know what is granularity at which we need to maintain data. Like (Country,product, month) may be one granularity and (State,product group,day) may be requirement for different client. It depends on key drivers what level do we need to analyse business.

There many databases which are specially made for datawarehouse requirement of low level indexing, bit map indexes, high parallel load using multiple partition clause for Select(during Analysis), insert( during load). data warehouses are optimized for those requirements.
For Analytic we require data should be at lowest level of granularity.But for normal DataWarehouses its maintained at a level of granularity as desired by business requirements as discussed above.
for Data characterized by 3V volume, velocity and variety of cloud traditional datawarehouses are not able to accommodate high volume of suppose video traffic, social networking data. RDBMS engine can load limited data to do analysis.. even if it does with large not of programs like triggers, constraints, relations etc many background processes running in background makes it slow also sometime formalizing in strict table format may be difficult that’s when data is dumped as blog in column of table. But all this slows up data read and writes. even is data is partitioned.
Since advent of Hadoop distributed data file system. data can be inserted into files and maintained using unlimited Hadoop clusters which are working parallel and execution is controlled byMap Reduce algorithm . Hence cloud file based distributed cluster databases proprietary to social networking needs like Cassandra used by facebook etc have mushroomed.Apache hadoop ecosystem have created Hive (datawarehouse)
http://sandyclassic.wordpress.com/2011/11/22/bigtable-of-google-or-dynamo-of-amazon-or-both-using-cassandra/

With Apache Hadoop Mahout Analytic Engine for real time data with high 3V data Analysis is made possible.  Ecosystem has evolved to full circle Pig: data flow language,Zookeeper coordination services, Hama for massive scientific computation,

HIPI: Hadoop Image processing Interface library made large scale image processing using hadoop clusters possible.
http://hipi.cs.virginia.edu/

Realtime data is where all data of future is moving towards is getting traction with large server data logs to be analysed which made Cisco Acquired Truviso Rela time data Analytics http://www.cisco.com/web/about/ac49/ac0/ac1/ac259/truviso.html

Analytic being this of action: see Example:
http://sandyclassic.wordpress.com/2013/06/18/gini-coefficient-of-economics-and-roc-curve-machine-learning/

with innovation in hadoop ecosystem spanning every direction.. Even changes started happening in other side of cloud stack of vmware acquiring nicira. With huge peta byte of data being generated there is no way but to exponentially parallelism data processing using map reduce algorithms.
There is huge data out yet to generated with IPV6 making possible array of devices to unique IP addresses. Machine to Machine (M2M) interactions log and huge growth in video . image data from vast array of camera lying every nuke and corner of world. Data with a such epic proportions cannot be loaded and kept in RDBMS engine even for structured data and for unstructured data. Only Analytic can be used to predict behavior or agents oriented computing directing you towards your target search. Bigdatawhich technology like Apache Hadoop,Hive,HBase,Mahout, Pig, Cassandra, etc…as discussed above will make huge difference.

kindly answer this poll:

Which tool/technology you use more often for analysis
Datawarehousing, ETL toolsBusiness IntelligenceHadoop,hive,Hbase,MahoutOther Bigdata tools


Some of the technology to some extent remain Vendor Locked, proprietory but Hadoop is actually completely open leading the the utilization across multiple projects. Every product have data Analysis have support to Hadoop. New libraries are added almost everyday. Map and reduce cycles are turning product architecture upside down. 3V (variety, volume,velocity) of data is increasing each day. Each day a new variety comes up, and new speed or velocity of data level broken, records of volume is broken.
The intuitive interfaces to analyse the data for business Intelligence system is changing to adjust such dynamism  since we cannot look at every bit of data not even every changing data we need to our attention directed to more critical bit of data out of heap of peta-byte data generated by huge array of devices , sensors and social media. What directs us to critical bit ? As given example
http://sandyclassic.wordpress.com/2013/06/18/gini-coefficient-of-economics-and-roc-curve-machine-learning/
f
or Hedge funds use hedgehog language provided by :
http://www.palantir.com/library/
such processing can be achieved using Hadoop or map-reduce algorithm. There are plethora of tools and technology which are make development process fast. New companies are coming  from ecosystem which are developing tools and IDE to make transition to this new development  easy and fast.

When market gets commodatizatied as it hits plateu of marginal gains of first mover advantage the ability to execute becomes critical. What Big data changes is cross Analysis kind of first mover validation before actually moving. Here speed of execution will become more critical. As production function Innovation givesreturns in multiple. so the differentiate or die or Analyse and Execute feedback as quick and move faster is market…

This will make cloud computing development tools faster to develop with crowd sourcing, big data and social Analytic feedback.
Master Data Management Tools in market

MDM:-> What does it do?

MDM seeks to ensure that an organization does not use multiple version/terms (potentially inconsistent) versions of the same master data in different parts of its operations, which can occur in large organizations.Thus CRM, DW/BI, Sales,Production ,finance each has its own way of representing things

There are lot of Products in MDM space One that have good presence in market are:

Tibco Information collaboration tool leader

Collaborative Information Manager.

– work on to standardize across ERP,CRM,DW,PLM

– cleanising and aggregation.

– distribute onwers to natural business users of data(sales,Logistics,Finance,HR,Publishing)

– automated Business Processes to clollaborate to maintain info asset and data governace poilcy

– built in data models can extended (industry template,validation rule)

– built in process to manage change elliminate confusion manageing change ,estb clear audit and governace trail for reporting.

– sync relevant subset of info  downstream application trading partner and exchanges.SOA to pass data to as web service to composite applications.

IBM MDM Inforsphere MDM Server

Still its incomplete i will continue to add on this.

Product detail( informatica.com)

source: (http://www.biia.com/wp-content/uploads/2012/01/White-Paper-1601_big_data_wp.pdf)

Short Notes below taken from source:+ My comments on them.

Informatica MDM capabilities:

Informatica 9.1 supplies master data management (MDM) and data quality technologies to

enable your organization to achieve better business outcomes by delivering authoritative, trusted data to business processes, applications, and analytics, regardless of the diversity or scope of Big

Data.

Single platform for all MDM architectural styles and data domains Universal MDM capabilities

in Informatica 9.1 enable your organization to manage, consolidate, and reconcile all master

data, no matter its type or location, in a single, unified solution. Universal MDM is defined by four

characteristics:

• Multi-domain: Master data on customers, suppliers, products, assets, locations, can be managed, consolidated, and accessed.

• Multi-style: A flexible solution may be used in any style: registry, analytical, transactional, or

co-existence.

• Multi-deployment: The solution may be used as a single-instance hub, or in federated, cloud, or service architectures.

• Multi-use: The MDM solution interoperates seamlessly with data integration and data quality technologies as part of a single platform.

Universal MDM eliminates the risk of standalone, single MDM instances—in effect, a set of data silos meant to solve problems with other data silos.

• Flexibly adapt to different data architectures and changing business needs

• Start small in a single domain and extend the solution to other enterprise domains, using any style

• Cost-effectively reuse skill sets and data logic by repurposing the MDM solution

“No data is discarded anymore!

U.S. xPress leverages a large scale of transaction data and a diversity of interaction data, now extended

to perform big data processing like Hadoop with Informatica 9.1. We assess driver performance with image files and pick up

customer behaviors from texts by customer service reps. U.S. xPress saved millions of dollars per year by reducing fuels and optimizing

routes augmenting our enterprise data with sensor, meter, RFID tags, and geospatial data.” Tim Leonard Chief Technology Officer

Source: U.S. xPress Big Data Unleashed: Turning Big Data into Big Opportunities with the Informatica 9.1 Platform.

Reusable data quality policies across all project types Interoperability among the MDM, data quality, and data integration capabilities in Informatica 9.1 ensures that data quality rules can

be reused and applied to all data throughout an implementation lifecycle, across both MDM and data integration projects (see Figure 3).

• Seamlessly and efficiently apply data quality rules regardless of project type, improving data accuracy

• Maximize reuse of skills and resources while increasing ROI on existing investments

• Centrally author, implement, and maintain data quality rules within source applications and propagate downstream

Proactive data quality assurance Informatica 9.1 delivers technology that enables both business and IT users to proactively monitor and profile data as it becomes available, from

internal applications or external Big Data sources. You can continuously check for completeness, conformity, and anomalies and receive alerts via multiple channels when data quality issues are

found.

• Receive “early warnings” and proactively identify and correct data quality problems before they happen

• Prevent data quality problems from affecting downstream applications and business processes

• Shorten testing cycles by as much as 80 percent

Putting Authoritative and Trustworthy Data to Work

The diversity and complexity of Big Data can worsen the data quality problems that exist in

many organizations. Standalone, ad hoc data quality tools are ill equipped to handle large-scale

streams from multiple sources and cannot generate the reliable, accurate data that enterprises

need. Bad data inevitably means bad business. In fact, according to a CIO Insight report, 46

percent of survey respondents say they’ve made an inaccurate business decision based on bad or

outdated data.9

MDM and data quality are prerequisites for making the most of the Big Data opportunity. Here are

two examples:

Using social media data to attract and retain customers For some organizations, tapping

social media data to enrich customer profiles can be putting the cart before the horse. Many

companies lack a single, complete view of their customers, ranging from reliable and consistent

names and contact information to the products and services in place. Customer data is

often fragmented across CRM, ERP, marketing automation, service, and other applications.

Informatica 9.1 MDM and data quality enable you to build a complete customer profile from

multiple sources. With that authoritative view in place, you’re poised to augment it with the

intelligence you glean from social media.

Data-driven response to business issues Let’s say you’re a Fortune 500 manufacturer and

a supplier informs you that a part it sold you is faulty and needs to be replaced. You need

answers fast to critical questions: In which products did we use the faulty part? Which

customers bought those products and where are they? Do we have substitute parts in stock?

Do we have an alternate supplier?

But the answers are sprawled across multiple domains of your enterprise—your procurement

system, CRM, inventory, ERP, maybe others in multiple countries. How can you respond swiftly

and precisely to a problem that could escalate into a business crisis? Business issues often

span multiple domains, exerting a domino effect across the enterprise and confounding

an easy solution. Addressing them depends on seamlessly orchestrating interdependent

processes—and the data that drives them.

With the universal MDM capabilities in Informatica 9.1, our manufacturer could quickly locate

reliable, authoritative master data to answer its pressing business questions, regardless of

where the data resided or whether multiple MDM styles and deployments were in place.

Self-Service

Big Data’s value is limited if the business depends on IT to deliver it. Informatica 9.1 enables your

organization to go beyond business/IT collaboration to empower business analysts, data stewards,

and project owners to do more themselves without IT involvement with the following capabilities

Analysts and data stewards can assume a greater role in

defining specifications, promoting a better understanding of the data, and improving productivity

for business and IT.

• Empower business users to access data based on business terms and semantic metadata

• Accelerate data integration projects through reuse, automation, and collaboration

• Minimize errors and ensure consistency by accurately translating business requirements into

data integration mappings and quality rules

Application-aware accelerators for project owners:

empowers project owners to rapidly understand and access data for data

warehousing, data migration, test data management, and other projects. Project owners can

source business entities within applications instead of specifying individual tables that require

deep knowledge of the data models and relational schemas.

•Reduce data integration project delivery time

•Ensure data is complete and maintains referential integrity

• Adapt to meet business-specific and compliance requirements

Informatica 9.1 introduces complex event processing (CEP) technology into data quality and

integration monitoring to alert business users and IT of issues in real time. For instance, it will notify an analyst if a data quality key performance indicator exceeds a threshold, or if integration processes differ from the norm by a predefined percentage.

• Enable business users to define monitoring criteria by using prebuilt templates

• Alert business users on data quality and integration issues as they arise

• Identify and correct problems before they impact performance and operational systems

• Speeding and strengthening business effectiveness Informatica 9.1 makes “MDM-aware”

everyday business applications such as Salesforce.com, Oracle, Siebel, SAP for CRM, ERP, and

others by presenting reconciled master data directly within those applications. For example,

Informatica’s MDM solution will advise a salesperson creating a new account for “John Jones”

that a customer named Jonathan Jones, with the same address, already exists. Through

the Salesforce interface, the user can access complete, reliable customer information that

Informatica MDM has consolidated from disparate applications.

She can see the products and services that John has in place and that he follows her

company’s Twitter tweets and is a Facebook fan. She has visibility into his household and

business relationships and can make relevant cross-sell offers. In both B2B and B2C scenarios,

MDM-aware applications spare the sales force from hunting for data or engaging IT while

substantially increasing productivity.

• Giving business users a hands-on role in data integration and quality Long delays and

high costs are typical when the business attempts to communicate data specifications to

IT in spreadsheets. Part of the problem has been the lack of tools that promote business/IT

collaboration and make data integration and quality accessible to the business user.

As Big Data unfolds, Informatica 9.1 gives analysts and data stewards a hands-on role. Let’s

say your company has acquired a competitor and needs to migrate and merge new Big Data

into your operational systems. A data steward can browse a data quality scorecard and identify

anomalies in how certain customers were identified and share a sample specification with IT.

Once validated, the steward can propagate the specification across affected applications. A

role-based interface also enables the steward to view data integration logic in semantic terms

and create data integration mappings that can be readily understood and reused by other

business users or IT. Big Data Unleashed: Turning Big Data into Big Opportunities with the Informatica 9.1 Platform

Economic slowdown Problem lesson and solution

Einstein: Predicted the Economic slowdown and related problems caused due to over use of mathematics when he said.
Albert Einstein said “Elegance is for tailors warning against mathematics do not believe in it only because its beautiful formulae”.
A monster called Synthetic CDO which was created caused the episode Financial crisis Investment banking fund demonstrated this overindulgence with mathematics..Sentiments are Psychology and sociology, the fundamentals are economics, finance and Mathematics is just calculation…What buddha said everything is in balance who can balance who is equal in all areas..who can do justice to each area and no preference of one. Its easy to make 200 rupees from 100 rupees but its difficult to make 200 crore from hundred crore because it averages out..hedge funds invest in bulk in big ticket investment which has similar effect the Macro and micro Economics conditions from time to time influences the particular sector with high growth trajectory..but the is law of diminishing marginal utility which when applied to market reads out..as more and more market absorb money the return averages out.person increases consumption of a product – while keeping consumption of other products constant – there is a decline in the marginal utility that person derives from consuming each additional unit of that product.

The utility of sector such as now biotech decreases out as more and more its absorbed in market. same way as we consume sweet first time we feel its very sweet as well marginally increase sweet amount of value we drive from it single unit decreses marginally

In buffet-style restaurants operate. They entice you with “all you can eat,” all the while knowing each additional plate of food provides less utility than the one before. And despite their enticement, most people will eat only until the utility they derive from additional food is slightly lower than the original.
Excellent Example: say you go to a buffet and the first plate of food you eat is very good. On a scale of ten you would give it a ten. Now your hunger has been somewhat tamed, but you get another full plate of food. Since you’re not as hungry, your enjoyment rates at a seven at best. Most people would stop before their utility drops even more, but say you go back to eat a third full plate of food and your utility drops even more to a three. If you kept eating, you would eventually reach a point at which your eating makes you sick, providing dissatisfaction, or ‘dis-utility’.

Quant of Investment banking depend on complex mathematics to predict interest rate of future, or how volatile interest rate in future,or prepayment be in future and translate into price depends on your view but mathematics did not cause financial crisis its the greed which caused financial crisis.It  can be corrected to win win for everyone what is needed is middle path which drives equal respect to Economics,Mathematics,Psychology,Sociology are are equally important.Mathematics is just medium if we do not quantise everything we cannot relate and predict it would be worst situation.But problem is actually these models are not predicting they are a views you drive..no body can predict in accuracy how many people are going to prepay there mortages or are going to default in future, or how many company are going to default in future.Its put in algorithms and then for sometime its very statisfying to see everything working according to it.CDO were excellent instruments where anyone get to choose from all risk first packaged into one bond then it can be sliced and diced based on risk you want to take you get to choose the slice.To Sell CDO you need to have big profit margin to cover risk or margin for error.When diminishing marginal utility comes into picture..First utility is great so everyone wants to enter in CDO then more people enter the competition increases the profit margin shrinks. the CDO brand then gets commoditized  which leads to fall in profit which investment banking firms take..so it profit decrease but margin for error is same..as more people enter market in CDO the size of investment becomes huge leading to fall in profit..and making it exposed to risk of margin of error which is not covered due to increased competition.Danger of mathematics credit derivatives become evident.

Minimal computation: abstarct manipulation of symbols,ability to see patterns in abstract mathematical symbol.Like probability of  housing loan defaults happening with behaviour of two companies going independently vis correlation the factors of probability of risk is high..how these mortgages interest with each other..but this is not problem then assumptions are made on top of it then its incorporated into model.

ROC curve applications in Gini coefficient economics , machine-learning

Gini coefficient of economics and ROC curve machine learning

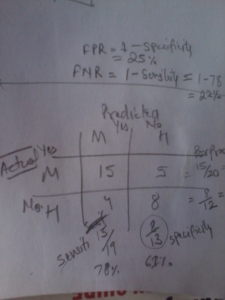
Receiver Operator curve or ROC curve are used in data mining , machine learning. from area under ROC curve u can calculate Gini coefficient. I have made an excel template

2013-05-12 18.58.03

Example to show how its calculated.

if AUC is area under curve then,

G= 2AUC-1

Gini coefficient the most watched coefficient of economics these days :
I wrote a article comparing different countries of world with data available

http://sandyclassic.wordpress.com/2013/02/06/watch-gini-coefficient-only-show-income-distribution-not-lowhigh-income-distribution/

Gini coefficient AUC has some component of noise which called to question of better measures which are used in machine learning DeltP or informedness ,mattews correlation coefficient each one is suitable to its own field while informedness=1 shows perfect performance while -1 represent perverse of negative performance despite all informedness. Economics Gini zero shows perfect equality.

So parameters keep improving there is no end result and there cannot be as our understanding increases we come at better measures and change is constant..but what is truth today was mystery or magic for old and would be kind of half truth for future..But the subjects are interconnected the branching of knowledge areas is going on since last 250 yrs.. earlier there was no engineering everything was under philosophy during Socrates. Socrates rightly said : that you cannot say anything with absolute certainty. But you can have informed decision that is what informedness quantifies that your decision how much they are informed decisions.

See a case from Biometrics:

submitAssign1